

Pre-aggregate telemetry. Ship less to your vendor.
Run stateful, event-time aggregations over OpenTelemetry and forward the aggregated metrics to your backend, not every datapoint. One Rust binary: in-process at the edge, or scaled across your cluster over a partitioned backend.
$ docker run -v $(pwd):/data ghcr.io/headrace-rs/headrace run /data/pipeline.yaml
How it works
Point OpenTelemetry at it, declare your transforms in YAML, and emit anywhere. Sources feed stateful transforms feed sinks - one binary, one file.
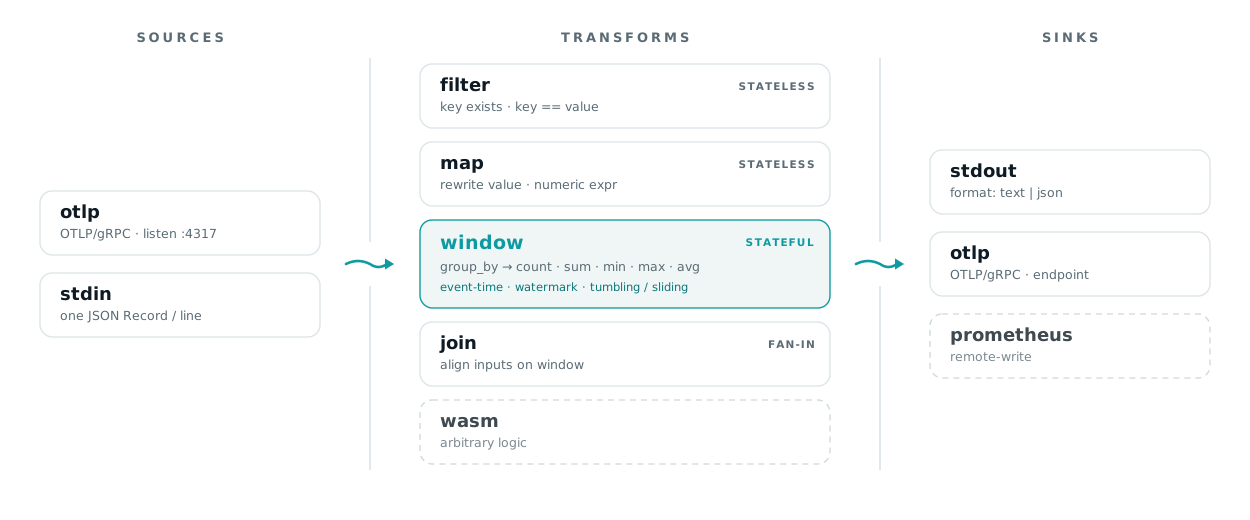
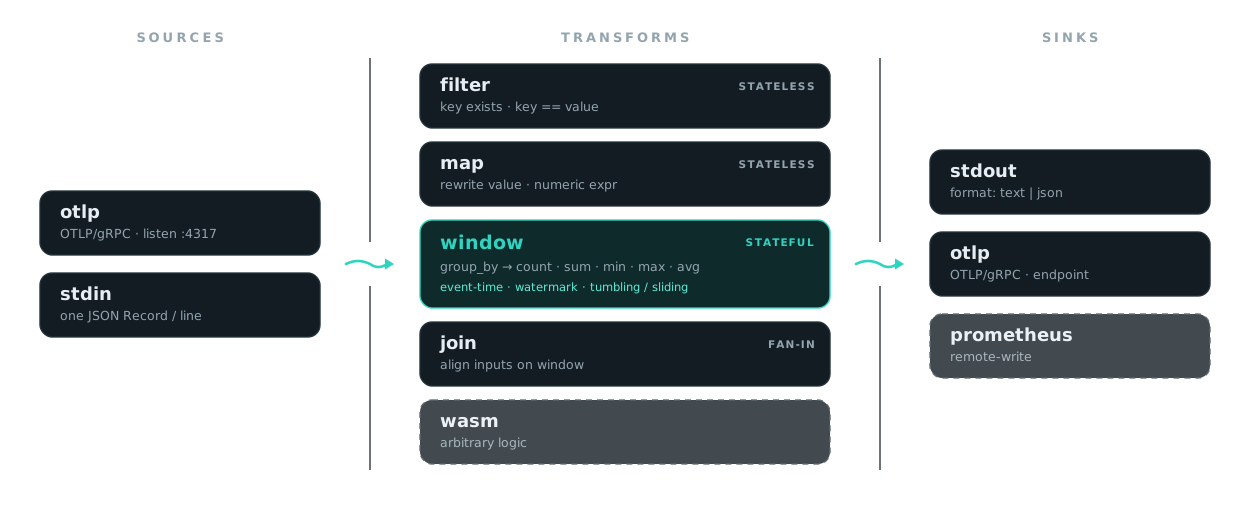
Ship less downstream
Emit a handful of windowed aggregates instead of thousands of raw datapoints. Your bill tracks signal, not volume.
Event-time windows
Watermarks, allowed lateness, tumbling and sliding. Correct under late and out-of-order data.
Edge or cloud, one binary
Run in-process for dev and the edge, or scale it across a cluster over a partitioned backend. OTLP in and out, either way.
A pipeline is a YAML file
Declare sources, transforms, and sinks. headrace validate checks it before it runs, and the same file runs in-process or scaled.
sources:
  - type: otlp
    id: in
    listen: 0.0.0.0:4317

transforms:
  - type: window
    id: windowed
    input: in
    size: 5s
    group_by: [service.name, http.route]
    aggregate:
      op: avg

sinks:
  - type: otlp
    id: out
    input: windowed
endpoint: http://collector:4317See it run
One command, one binary. A generator feeds a filter and a 5s window; every 5 seconds headrace emits the average request latency per route.